Tutorial Surface New
Parametric or Surface Rietveld Refinement – 2017 Update to #list Language (see newer-still tutorial)
Files needed: d9_02592.raw, wo3_p21n_80056.cif, wo3_pb1_80053.cif, wo3_pc_84843.cif
Cheat files: d9_02592_p21n_01.inp, d5_02592_pb1_01.inp, d5_02592_3phase_01.inp, wo3_t0000_04.inp, parametric_04.inp
Learning Outcomes: These exercises give an introduction to surface Rietveld refinement and its potential benefits. For more details see Stinton/Evans J. Appl. Cryst. (2007). 40, 87–95. The example is also covered in Chapter 12 of the Rietveld text by Dinnebier, Leineweber and Evans. Warning: this is hard!!
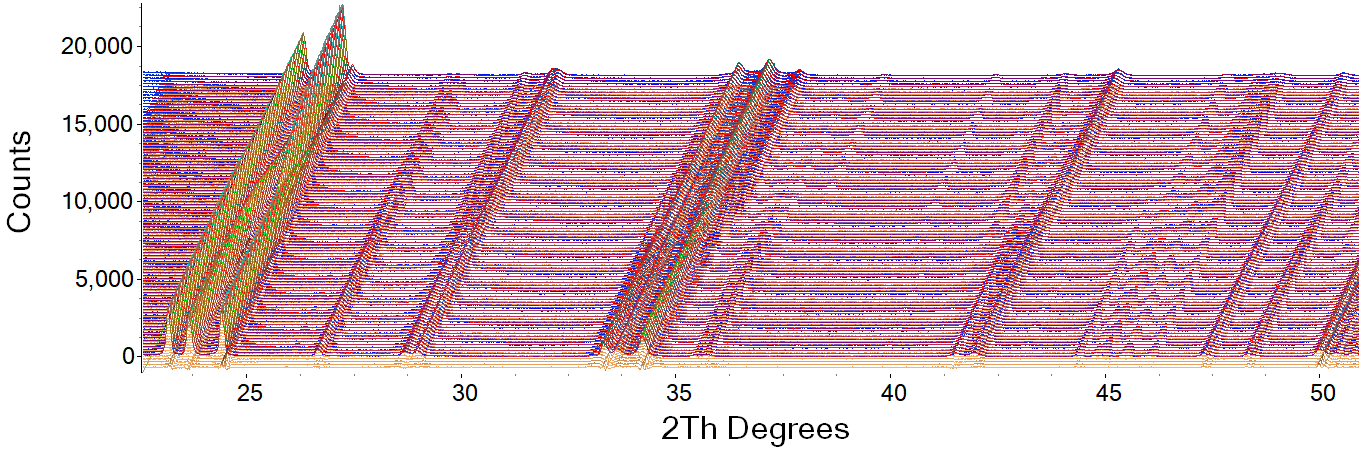
The example used is variable temperature diffraction data on WO3 as it’s cooled from 300 to 100 K. Over this range the material undergoes a series of relatively subtle phase transitions. The space group changes from P21/n to P-1 to Pc on cooling. Since the structural changes are relatively minor, quantitative analysis of the data is difficult. For example even though the sample is predominantly monoclinic P21/n at room temperature, the lower temperature P-1 structural model will actually fit the data better.
In the first part of the tutorial you will try and fit room temperature data using either a P21/n or P-1 model. You’ll then perform a 3 phase refinement using P21/n, P-1 and Pc structural models on room temperature data. If you use this same file to refine against low temperature data then try the room temperature refinement again you’ll get different answers for relative amounts of phases each time. One solution to this is to perform a parametric/surface fit where you “force” the cell parameters of each phase to vary smoothly over the entire ensemble of data. This gives reliable quantititative refinement which agrees well with neutron diffraction experiments.
The .raw file contains 100 data sets recorded as the sample was cooled from 300 to 90 K.
This tutorial has been rewritten (2017) to use much simpler language than the original tutorial. The original tutorial is linked here if you want it.
New topas commands (2020) that will be available in future releases mean that parametric fitting is now as easy as fitting a single data set. The first version of this tutorial needed an INP file that was 25,660 lines long. This version uses an INP file 11983 lines long and the latest way of doing things needs ~400 lines! Go here for the newer tutorial.
Room Temperature Refinements
Learning outcome: different models fit room temperature data equally well – a problem!
1. Save the datafiles and cif files above to your directory.
2. Use the Durham “Simple Rietveld Refinement” menus to perform a refinement of 300 K data (range 1 of the raw file) using the P21/n structural model (wo3_p21n_80056.cif). The instrument used to collect the data was the durham d9. You should refine a height correction. Fit data from 20 to 80 degrees 2-theta. Refine a single overall temperature factor. Refine W xyz coordinates. You should get Rwp = 14.49% for a default set of 24 parameters.
3. Try an equivalent refinement using the P-1 model (wo3_pb1_80053.cif). You should get a lower Rwp = 14.33 % for 32 parameters. If you have trouble with this refinement try starting the cell parameters at the values you got for the P21/n model (7.30, 7.53, 7.69, 90, 90.8, 90).
4. Set up a three phase refinement in which the P21/n, P-1 and Pc models are fitted simultaneously to the room temperature data. Use the same peak shape for all 3 phases. You should get Rwp ~12.7 % for a 48 parameter model. Try the file d5_02592_3phase_01.inp linked above to save time.
5. Note down the phase fractions you get at room temperature for the 3 phase fit. I got 77/22/1 %.
6. Try using your file to fit a low temperature data set. Put “range 50” after the filename in the input file. This is a 195 K data set. After fitting range 50 try fitting range 1 again. Note down the phase fractions.
7. Repeat 6 by fitting e.g. range 60 (174 K) then range 1; range 30 (238 K) then range 1; range 100 (90 K) then range 1. Note down refined phase fractions at 300 K each time. You should find they’re different each time you refine against the room temperature data despite all refinements having very similar R-factors.
Parametric Refinements
In this section we’ll go from fitting a single file to fitting many data sets simultaneously. In previous section we concluded that many different models will fit the room temperature data equally well. However if we have data collected at several temperatures we can try and fit all data sets simultaneously. It’s likely that there’s only one physically sensible model that will fit all the data simultaneously.
1. Save the file wo3_t0000_04.inp to your directory. This file is 100% equivalent to the file used for 3 phase refinement above. It’s set up in the language needed for surface fitting. Look through the file and note the various sections. Try fitting the room temperature data with this file. You should get Rwp ~ 11.6 % with 61 parameters refining.
2. Spend some time reading through wo3_t0000_04.inp to understand the format. The file uses jedit folding to separate out the different sections. It also makes use of #ifdef something…#endif language. This lets you use the file in different ways for different purposes. Section 1 has some choices about the refinement. Section 2 is set up so you can refine data sets independently in topas v6. Section 3 lets you choose which data set to refine. Section 4 contains the refinement information for an individual dataset. It makes maximum use of “local” variables so that surface fitting is easy. The next section has “overall parameters”. These are parameters that will feed into each data set when surface fitting. For example, coefficients for equations that describe thermal expansion are here. The next section has “for xdds” and “for strs” instructions. These contain parameters that apply to each data set and to each str in each data set. Finally there are some macros at the end of the file for controlling refinements. The file has instructions in it for outputting the refinement results to “results.txt” and optionally for writing Rietveld fit files.
3. Save the file parametric_04.inp to your directory. This file will do a parametric fit of 11 data sets from 300 to 90 K simultaneously. The only constraint put on the data is that the cell parameters of each phase should vary smoothly with temperature. Run the file. You should get Rwp ~ 12.5 %.
4. The file “results.txt” contains all refinement details from parametric_04.inp. Use e.g. excel or gnuplot to plot the results. If you’re a gnuplot person then you can just: load ‘plot_multitopas.gnu‘ and see all the results on screen and in .gif files.
5. The parametric fit is set up to refine only 11 data sets by default. If your laptop is up to it then try refining all 100 data sets. You can do this by commenting out the line that says “#define use_some”. You should be able to get Rwp < 13.0 % for all data sets.
6. parametric_04.inp is set up with lots of “#ifdef” statements which let you fit different models. Try playing with different options.
7. You might be interested in how parametric_04.inp was created. This is done by saving just the portion of wo3_t0000_04.inp that describes refinement of an individual data set to a separate file. A simple program then automatically replaces parameter names by values specific for each data range. Download substitute.exe and range.val and save in your folder. Run substitute.exe and answer the questions. Choose read “temperatures” from a file option and give filename “range.val”. Have a look at the files produced “temperatures.prm” has the lines you use to control which datasets are fitted. multi.inp contains instructions for each dataset. These can be combined with the “header” information in wo3_t_0003.inp to produce a file equivalent to parametric_04.inp. If you’re a linux person you could use a command file using a simple “sed” subsitution like: sed ‘1,$s/t0000/t0001/g’ single.riet
8. You can compare the results from parametric fitting with refining individual datasets using wo3_t0000_04.inp. If you include the line that says #define fit_all_v6 then the topas v6 #list command will refine all datasets. You’ll see that even a well set up file like this can “fail” near the phase transition. See the plot below for how the phase fractions compare from parametric fitting (closed points) and individual (open points).
9. You might want to compare using parametric_04.inp with the command #define param_cell turned on and turned off.
8. A bottle of chianti for anybody who made it this far.